Monday, September 30, 2013

DIvidend Compass - Royal Dutch Shell

Todd Wenning's Dividend Compass is a diagnostic tool that covers the parts of fundamental analysis most useful to dividend investors. This is a pretty broad set of metrics, Todd describes them here:


  • "Sales growth: Sales are the life-blood of a company. If sales are drying up, that puts added pressure on profits and cash flows and thus the dividend, too.
  • Interest coverage (EBIT/interest expense): If a company is having trouble paying the interest on its debt, there's a greater chance that its creditors will get worried and raise the company's cost of borrowing, which could reduce net income. In a worst-case scenario, the dividend could be cut to accelerate the repayment of principal. 
  • Net debt/EBITDA: This is a common measure ((Debt-Cash)/EBITDA) that creditors and ratings agencies use to determine credit quality and it's commonly used as a metric in debt covenants. A firm that has borrowed too much or is struggling to pay down its debt relative to its profitability is more likely to have a risky dividend.
  • Dividend growth rate: A slowing dividend growth rate could be a sign that the company is less confident in its future growth potential. Eventually, all companies' dividend growth rates decline, but you want to see a steady decrease over many years and not a sharp drop.
  • Earnings cover: Even though I don't think it's the best measure of dividend health, earnings cover (Net Income/Dividends Paid) remains the most common metric cited by both companies and investors alike, so it should be considered in any dividend analysis.
  • Free cash flow cover: Free cash flow cover ((CFO-CapEx)/Dividends Paid) is a better measure of dividend health than earnings cover because companies don't pay out earnings -- they pay out cash. As such, I'd rather look at a company's cash flows than net income.
  • Operating margin: A company whose margins are contracting could be facing increased competitive pressures or becoming less efficient. When this occurs, less money falls to the bottom line and to cash flows and the dividend can become riskier. Cyclical companies' margins will naturally ebb and flow. In those cases, use rolling 5-year margins to account for the business cycle.
  • Return on equity: Companies that are unable to sustainably generate returns above their cost of equity are likely destroying shareholder value and usually have lower growth potential. Neither are good things from a dividend perspective."
I have found this a very handy tool to slice and dice a company's dividend related data. For one thing, it s a good reminder to look at coverage from multiple perspectives. Dividend Compass weights FCF cover as 25% of its rating.

The Dividend Compass ranks stocks using this rating system
I put Royal Dutch Shell (RDS.B) through the Dividend Compass to get a closer look at the health of its dividend. The results were mixed


Royal Dutch Shell scores well on earnings and revenue related metrics but its Free Cash Flow is pretty mixed. The other negative factor which is pretty easy to spot is anemic dividend growth. You can see the data input below that generate the scores above.

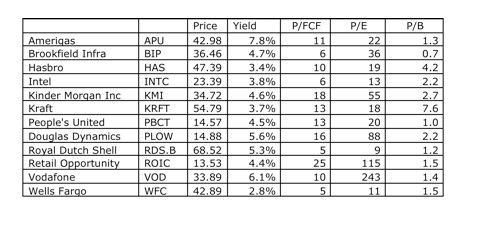
All in all Dividend Compass is a valuable analytical tool. It incorporates most of the key objective data and presents it in a way that helpful to do a quick first pass to get a feel for the company's viability for a dividend investor. The weightings and rankings are subjective, people can have different opinions on them, but they strike me as roughly right. Especially the focus of Free Cash Flow. Notice that yield which is most everyone's first thought in dividend investing does not count for much. Thus, Royal Dutch Shell does not get all that much credit from the Dividend Compass for its 5.3% yield. 

Dividend Compass is not a substitute for in depth research. It does provide a profile sketch of the company, in about five minutes of analysis, a picture of Royal Dutch Shell emerges - well managed earnings, good not great on margins and ROE, poor dividend coverage and oscillating FCF cover. It requires more investigation to get beyond these numbers but like all good analytical tools Dividend Compass leads you to the next level of interesting questions to ask.

Friday, September 27, 2013

One Reason Dividend Investing Works So Well

I am sure there are a number of reasons why dividend investing works, not the least of which is dividends role in long term total returns.

I see another factor that dividend investing one reason why dividend investing works so well, and it has to do with the investor's thought process.

Dividend investing basically forces you to think about next quarter, next year, three years, five years, ten years, and so on. That's diametrically opposed from traders who hang breathlessly on taper this or QE that. As Matt Coffina said "in 10 years who is going to care whether the taper started this month as opposed to next month or the month after."

Guessing about macro factors is not a game worth playing in my view. Investing is about long term, not  headlines in the current month.

So to get a long term orientation its important to have a different thought process. Dividend investing helps here. After all who cares about a 3% current yield? No one puts their money at risk to earn 3%.

But what you're really thinking about in dividend investing is seeing that yield double to 6%. It takes years for that to play out, years before things get interesting.

So the questions are along the lines of - how long will it take to double today's 3% yield to 6% yield on cost?  These things take time. Years. The thought process is about long term process of getting there, not flavor of the month IPOs, deciphering Fedspeak, macro guru pronouncements, etc.

From there you get to the questions which are the true essence of  investing - over that time horizon what competition will come into play? How wide is their moat? How sustainable is their competitive advantage? Once you are asking these questions, you are thinking like an investor not a trader.

So that's a subtle but absolutely crucial advantage in dividend investing - you're automatically oriented to a long term outlook.

Tuesday, September 17, 2013

Portfolio Review with the 5+5 Rule

One of the main metrics in the Snowball Portfolio is the 5+5 rule, which I learned from Daniel Peris' excellent book - Strategic Dividend Investor (side note- Peris can write and is a man who really loves his dividends). Like most useful rules, its very simple - look for a combination of 5 percentage points of current dividend yield plus 5 percentage points of dividend growth. The total should be at least ten percentage points, so a company with a 3% dividend yield would need at least 7% dividend growth to clear the bar. Likewise a high yielding company with say 8% would only need a tepid 2% growth to get over the 5+5 hurdle.

The rule is not about mathematical precision as much as its about orienting your frame of reference for investment selection and ongoing portfolio management - what am i looking for with this investment? What does "good enough" look like?

Its not the only metric, and probably not even the most important one, but its handy test that you can run every year to do a checkup based on your goals. Having hurdle rates for each company sets the expectations on what you're looking for for each kind of company. Is it a lower yielding but higher growing company or a high yield, steady as she goes? The Snowball Portfolio has both kinds. Here is the current check up for how many companies have cleared the 5+5 hurdle for 2013.

Overall I am pleased with the progress. Amerigas, Brookfield Infrastructure, Hasbro, Kinder Morgan, Retail Opportunity, and Wells Fargo have all cleared  the bar. Royal Dutch Shell and Vodafone are pretty close.

The other piece of the analysis is identifying those companies not clearing the bar. When will we see a meaningful dividend increase from Intel, Kraft, People's United, and Douglas Dynamics? Its not something to panic about in any of these cases, in my view, but its good to be aware. So from an ongoing monitoring standpoint the simple 5+5 Rule helps you focus on companies and could signal places where they might stall out.

Its just one way to combine data points, but its a tool I have found it useful both on the selection part f the process as well as on the ongoing monitoring and management part of the process.

Monday, September 16, 2013

Snowball Portfolio


“'Life is like a snowball. The important thing is finding wet snow and a really long hill.” – Warren Buffett

Purpose
The purpose of this portfolio is to protect capital, identify growing dividends, and provide long running income streams.

Portfolio Selection & Goals
This portfolio looks for companies with the following characteristics:

* Margin of Safety - companies should exhibit a durable competitive advantage to protect the company's cash flows and the ability to payout dividends

* Yield - A higher than average dividend yield. Generally only interested in the companies with the ability to pay at least 50% more than the current S&P 500 yield

* Low payout ratio - stocks should payout a low percentage (generally less than 60%) of their overall profits as dividends. This is to protect the dividend in the event of downturns.

* Dividend growth - stocks selected for this portfolio should be able to support a dividend growth rate that combined with their current yield exceeds 10 percentage points. For example, a stock paying 3.5% dividend yield should be able to grow its dividend by at least 6.5% or more each year

The primary metrics that I use to measure the performance of the Snowball Portfolio are as follows:

  •  Total Return: the combined return of the stocks’ capital gains plus the dividend income received 
  •  Current Yield: the “look through” yield of the portfolio as a whole
  •  Dividend Raises and Cuts: tracking the total number of the Portfolio companies’ dividend raises and cuts over time

Current portfolio metrics


Sunday, September 15, 2013

The Wine Cellar - Brett Arends on Bunting's Laws

The Wine Cellar series journals investing analysis that I find valuable over the long haul. This entry is more like a nice warm pint of ESB. One hidden gem I came across last year is Brett Arends' account of Bunting's laws - 12 stock investing rules for the next forty years.

One of my favorite aspects of these rules is that the first seven rules are on reasons to avoid investing in companies:
    1. Sell stocks of companies that announce huge acquisitions, that overdiversify, or that spend a fortune on a lavish new headquarters.

    2. Avoid stocks where management picks fights with analysts (or, by extension, hedge funds). See Overstock.com in 2005; Netflix in 2010.

    3. Watch out when executives start selling a lot of stock — regardless of plausible-sounding excuses. Top execs in homebuilders, mortgage underwriters and Wall Street dumped billions before the 2008 crash.

    4. “Run a mile” from all stocks in an industry going through a huge investment boom: Massive overcapacity and consequent collapse is inevitable.

    5. Steer clear of investing in manufacturing companies. Their industries are usually plagued with extreme cycles of boom and bust, overcapacity and slumps.

    6. Pay little attention to economists or market gurus.

    7. Mistrust all mathematical trading formulas as well — they invariably fail just when you most need them to work.

A current example of a violation of rule #1. Coach (COH) is a company with a lot to recommend it from an investment standpoint. Its been a leader over many years, trades for a bargain valuation (15 P/E), excellent margins  (20% Net Margin), Return on Equity at 47%, and no debt. What's not to like? This - a new $750 Million Headquarters.

As much as the valuation metrics are appealing, spending nearly one billion dollars on a new HQ sounds to me like the opposite of shareholder focus. Rules like Bunting's Laws serve as a critical checklist to get investors to think beyond just the numbers and look at behavioral and other factors.

As Brett Arends' wryly notes "Not all of Bunting’s Laws are about stocks to avoid.":

    8. Look for companies where the insiders are buying lots of stock.

    9. Look for companies generating a lot of cash — a great sign of sustained outperformance.

    10. Look for companies which have monopolies (or near monopolies), and those which manage to take out their main competitors.

    11. Remember you are buying businesses, not just stocks. Pay close attention to the quality of the business, and especially the quality of the management.

    12. Look for companies which have earned the trust of consumers, and which have very strong brand names.


As to rule #8, insider buying is always a welcome sight. Recently, Kinder Morgan (KMI) was recently targeted by short seller. Last week, two insiders responded vigorously to the 6% drop. CEO Rich Kinder bought 500,000 shares and Director Fayez Sarofim bought 283,000 shares. Its always good to see management aligned with outside shareholders.

Investing relies heavily on analyzing financial metrics, but we have to go inside the numbers to better understand what's going on. In addition, the numbers out of context may not give a full picture and lead us to take undue risk. Think of the great looking metrics companies in the housing industry had leading up to the crash. For this reason its essential to have a combined view of the financial metrics with checklist like Bunting's Laws, the fact that the Laws are weighted with things not to do is a great example of how these rules are most helpful to the investor.

Its true that not all of Bunting's Laws are about stocks to avoid, but the laws on what to avoid are the most valuable because they illustrate traps for the investor to avoid and enumerate reasons to eschew investing in companies with otherwise compelling metrics.

Saturday, September 14, 2013

The Wine Cellar - The Remarkable True Story of a $146,194-Per-Year Income Portfolio

Brian Richards reports on the science fiction writer Hayford Peirce's $146,194 per year Income portfolio. It is a concentrated high yield portfolio:

  • Three common stocks (Altria, J&J, Philip Morris International)
  • Nine master limited partnerships (Alliance Resources, Enbridge Energy, Energy Transfer, Enterprise Products, Inergy, Kinder Morgan, ONEOK Partners, Plains All American, and Suburban Propane)
  • One bond
  • One annuity
    His Altria investment is an incredible story. Hayford began buying shares of the tobacco company back in 1987, when it was quite a bit more than just a tobacco company. Over the years, he kept buying more (in '88, '91, '96, and '97), and eventually accumulated 11,000 shares of Altria (then known by the more familiar Philip Morris name). "Every time there was a panic in the market about Philip Morris, it would go from $70 down to $20 because of a smoking case, I would go out and I'd buy some more." Through spinoffs, his original 11,000 shares of Altria stock turned into an astounding 11,000 shares of Altria, 7,000 shares of Kraft, and 11,000 shares of Philip Morris International.
    He still owns Altria and Philip Morris International, but sold Kraft. "At one point my basis for everything, including the Kraft [spinoff], was about $200,000 and it was worth about $1.25 million."

There are a number of takeaways here, first is focusing on dividend over the long run. Patiently building positions over a long time horizon.


Then there is the importance of dividends in long term investing. The story of Hayford Peirce is a concrete example of James Montier's Dividends Still Matter example, which shows that on a one year time scale dividends and dividend growth account for only about 20% of total return to the investor. However over a five year time horizon, dividends and dividend growth account for around 80% of the total return. In my opinion, its foolish to invest for only one year, too many things can happen, and so investing requires a longer term outlook.

Given that then dividends come to the fore in any investment analysis. What we need to look for varies slightly though. Its less about current yield although that clearly matters. A useful metric is Yield on Cost (or effective yields):

30% yields
That Altria investment is spinning off incredible "effective yields" -- measuring today's dividend checks against the original cost basis, rather than the current share price. Hayford's getting a 37% yield on Altria and a 28% yield on Philip Morris International.
That's by design. About half of the $146,194 in investment income will come from Hayford's annuity and the lone bond. The other half will come from a very deliberate investment process in dividend stocks. On a 1995 trip to Tahiti (where he lived for 25 years), Hayford sat down with a legal pad, pen, and his collection of stock tickers:
I was looking over my portfolio. And say there were 12, 14 companies in it, and 8 of them were blue chips like GE and Coke and Johnson & Johnson. … I said, "These suckers are bringing in $14,200 in income this year. Let's see what would happen if we just increased that dividend by 10% every year for 30 years."
Upon returning to the States, he transferred his legal pad scribblings to a series of spreadsheets, and the long-term vision for these 12-14 dividend stocks took hold. His stated goal was to increase his annual investment income from $14,200 in 1995 to $250,000 in 2025. "Up until a year and a half ago, I was ahead."
Then the financial crisis hit, former widow-and-orphan stocks like GE and Bank of America (both owned by Hayford in '08) slashed their dividends, and even the best-laid of plans went to mush. Hayford tilted his dividend portfolio toward high-yielding MLPs.


Yield on Cost is a misunderstood metric, as an input to current decision making its mostly useless.

For example, would I rather own Chevron or Exxon? Chevron (3.3%) pays a higher dividend yield today than Exxon (2.9%).  But let's say I bought Exxon back in 2005 and since then their dividend has doubled. So my effective yield on Exxon is more like 5.8%, so wouldn't I rather own Exxon at 5.8% than Chevron? No because the 5.8% is only on cost and if I sold all my Exxon and put it all into Chevron then I would increase my current yield by more than 13% (the difference between 2.9 and 3.3). That current income is predicated on current yield not yield on cost.

So if current yield is all that matters then why focus on Yield on Cost at all? Yield on Cost is useless as a comparison metric but in my view its very helpful for planning and goals because it clarifies what you are shooting for. In other words, my goal as a dividend investor is to generate as many double digit percentage yield on cost as possible. Getting to 30% can take awhile, but 10% Yield on Cost is doable for a number of different companies. A 4% current yielder that  raises its dividend 10% year will be over the 10% Yield on Cost hurdle in ten years.

So focusing on identifying candidates for double digit Yield on Cost percentages means that you are looking for companies that will be there for the long haul. You have to look at different factors. Quality matter, sustainability matters. Flavor of the month companies need not apply. The companies need to be able to withstand two business cycles, recessions and other events that a decade can throw at it. Its a totally different game and totally different metrics than trying to handicap what iPhone 5's impact will be, Twitter's IPO or almost any headline that dominates business news. But for long term return generation, the fact that dividend corner of the market is underfollowed is a great opportunity.

The question to ask to generate high yield on cost is not so much what the company is going to do this year or next, but rather can the 3-4% yielder triple its dividend over the decade? This mindset is about as far from a short term mentality as you can imagine. 

Friday, September 13, 2013

Hoping Elizabeth Warren Can Stop Obama from Nominating Larry Summers

Jeremy Grantham “When asked by Barron’s if we would learn anything from this ongoing crisis, I answered, ‘We will learn an enormous amount in a very short time, quite a bit in the medium term, and absolutely nothing in the long term. That would be the historical precedent.’"

Its quite amazing then (or not if you consider the above) that five years after the financial crisis, Larry Summers is apparently a leading contender for the Fed chair. Here is Larry Summers on one of his brainchildren, the repeal of Glass-Steagall:

''Today Congress voted to update the rules that have governed financial services since the Great Depression and replace them with a system for the 21st century.''

This was not the only factor in the 2008 meltdown, but it was a key ingredient in its spreading. Not only have we not learned the lesson and reinstalled Glass-Steagall, grown adults are talking about bringing the architect of its demise back in a bigger role. If the Fed chair's job is to take the punch bowl away just when the party is getting started, then why bring someone in, who not only did not take it away, but poured gallons of Everclear in the punchbowl?

Luckily, not everyone has forgotten. Elizabeth Warren has serious concerns about Larry Summers at the Fed. Hopefully, she can stop Obama from making a serious blunder here, that alone would be a huge success.

Tuesday, September 10, 2013

The Wine Cellar - James Montier: Dividends Still Matter

One of the main things I am using the blog for is an ongoing notebook of my favorite insights on investing.  The Wine Cellar is the ideas, papers and analysis that are most useful and informs my perspective over the long haul.

So the first one to be added to the Wine Cellar of ideas is from James Montier's August 2010 paper "A Man from a Different Time"
    Dividends still matter
    To those who charge around in markets trying to guess
    the next quarter’s make-believe earnings number, the
    concept of dividends seems wholly irrelevant. However,
    to those with an attention span measured in longer than
    milliseconds – who are few and far between, to judge
    from today’s markets – dividends are a vital element
    of return. Exhibit 2 illustrates this point graphically.
    Looking at the U.S. market since 1871, on a 1-year time
    horizon, nearly 80% of the return has been generated by
    fl uctuations in valuation. However, as the time horizon
    is extended, “fundamentals” play an increasing role in
    return generation. For example, at a 5-year time horizon,
    dividend yield and dividend growth account for almost
    80% of the return.


Having a long term orientation is fundamental for individual investors. I think the ability to have a longer time horizon is our single biggest advantage over the pros, we can be patient and wait out 3 years, 5 years for things to play out. Pros have a bad quarter and then they are updating their resume LinkedIn. They cannot wait it out.

But the time horizon advantage is amplified if we focus on approaches that unfold (albeit slowly) over time. This insight highlighted for me the importance not just of dividends, but dividend growth as the overriding factor in long term returns. If you are measuring your investing lifecycle in years and decades, not mouse clicks, milliseconds, and Cramerisms, then dividend growth is like having the wind at your back.

Dividend growth investing moves the focus from not just preferring higher yielding companies over those with low or no dividends, but more in the direction of companies that can grow their dividend by meaningful percentages year after year. Time is the friend of the dividend growth investor.

Tuesday, September 3, 2013

Dividend Detective Work and the Verizon/Vodafone Deal

The biggest deal story of 2013 is Verizon (VZ) buying the remaining 45% of Verizon Wireless that it did not own from Vodafone (VOD). The specifics of the deal are interesting and include Verizon paying a mix of cash and its own shares. Vodafone is passing along the majority of the purchase price to its shareholders, which was somewhat of a surprising move.

For a US shareholder, receiving Verizon shares should not be a major hassle, Vodafone shareholders can elect to hold or sell any Verizon shares they receive. There are, of course, many Vodafone shareholders in the UK and elsewhere, and I am curious how this works for them since I do not believe that Verizon shares trade on the London markets. And then there are the FTSE indices and such where Vodafone is a major holding, so it will likely require a bit of market plumbing to really push the shares all the way through.

At any rate, this deal has been rumored for a decade or so. It heated up last winter, the rumored price at the time was $100B which seemed to undervalue Verizon Wireless' business. So it was good for Vodafone shareholders that their management was able to hold out for a ~30% premium. Two drivers held in Vodafone's favor to negotiate a better deal. First, likely interest rate rise, any rise in interest rates would cost Verizon (who financed $50B worth of bonds) in the hundreds of millions of dollars.

Secondly, there is the matter of Verizon's dividend. The main appeal for companies like Verizon, Vodafone, and AT&T (T) is income. In analysing Verizon's dividend profile, its readily apparent just how much it needs ongoing access to Verizon Wireless' cash and how its unable to support its dividend without it.

Verizon's payout ratio crested 100% in 2009 and has remained above that level since.


2009 2010 2011 2012
Payout Ratio  145% 214 232 654

As Herb Stein said "anything that can't go on forever won't." It was pretty obvious that from a dividend perspective, a multi year stay above 100% payout ratio, something had to give. Either Verizon probably had to cut its dividend (which was surely unthinkable) or it needed access to ongoing, reliable cash flow which it was able to secure via Verizon Wireless.

One of the appealing parts of dividend analysis is that it sheds light on the business dynamics from a different viewpoint, and adds another dimension to consider even in a story like Verizon Wireless which on the face of it isn't primarily about dividends.

**

Vodafone shareholders have some thinking to do at this point. They have to think whether Vodafone is worth holding going forward, absent its most valuable asset. They also have to think about what to do with the Verizon shares they will soon own.

If we look Vodafone, Verizon and AT&T and consider two important metrics - income (yield) and safety (debt/equity) - then Vodafone looks the most interesting on this basis especially since it plans to pay down its debt while Verizon's will increase substantially should the deal go through.

 VOD   VZ   T
Yield   6.4%  4.4  5.4 
Debt/Equity  0.4  1.2  0.8

There are many other factors to consider as the dust settles on all of this but on income and safety, Vodafone shareholders, with the highest yield and least levered balance sheet, may feel as though they had it pretty good.