"Why Moats Matter for Equity Income" Josh Peters, Morningstar
"The first thing you have to remember about dividend investing is that dividends are paid out slowly, though, relentlessly, and they really add up over time. But if you're going to actually buy a stock for its dividend, then this is going to be probably a five-, 10-, or 20-year-type of relationship. That means you have to think about their earnings potential and growth potential of the company, five, 10, 20 years, or longer into the future.
Now most of Wall Street focuses on those short-term news events. What will [the companies] make this quarter? Will they beat estimates? Will they raise forecasts? But again, if you're hanging around for the dividend over the long run, then you have to think about the long-run earnings power, and that is almost entirely going to be shaped by the company's competitive position in its industry. What's the industry structure like? Can the company actually preserve a good level of profitability and be able to grow in its field over the long term without competitors coming in and slashing away prices and ruining the game for everybody.
So, to have an economic moat and to be able to identify what it is that protects this business and its profits and its future growth potential from competition, is absolutely essential. It may not seem like it has a lot to do directly with dividends, but it really does."
Josh Peters nails the intersection of quality and dividends. I wrote about a similar concept - One Reason Why Dividend Investing Works So Well - who cares about a 3% yield? Its chump change on a short term on a basis, but not a long term basis its anything but. You want to see the dividend grow over time. If you want your 3% yield to grow to 10% yield on cost, even if it grows by 10%+ per year, you are still going to be holding the stock for a decade to get there. And longer to realize the long run benefits. So you're automatically re-oriented to businesses with staying power. Criteria should focus on identifying marathon runners not sprinters.
Friday, October 25, 2013
Thursday, October 24, 2013
Dividend Compass Cup Match 10 - Exxon Mobil vs Wal-mart
Here in match 10, we are in the second round of the Dividend Compass Up, the winner will go on to the Final four. We have two formidable companies, with real earnings power- a Texarkana border battle - Exxon Mobil vs Wal-mart.
The Dividend Compass Cup rules are straightforward, we run the two quality, wide moat companies through the Dividend Compass to analyze which is the more interesting investing candidate. Todd Wenning's Dividend Compass scores them 1-5.

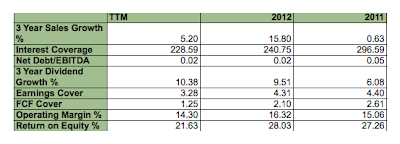
First up Exxon Mobil, basically no debt, increasing dividend growth and solid ROE.
Exxon Mobil Metrics
 Biggest worrying sign for Exxon is the slowing FCF cover which is a big concern for income investors and so counts for a lot in the Dividend Compass. A solid 4.3 five year average, is a respectable outing for Exxon.
Exxon Mobil scores

Wal-mart is no dividend slouch. Its dividend is double covered both on FCF and Earnings. Plenty of room to grow and/or absorb slowdown. On the plus side, there is still slow but steady growth, and excellent dividend growth.
Wal-mart metrics

Put it all together and you get a sizzling 4.57 five year averages. About the only area Wal-mart struggles is margins, and frankly - how concerned should we be about that? After all, its the Bentonville business model.
Wal-mart score:

Exxon Mobil has a great track record, but Wal-mart is simply playing at a different level here, even their negatives, in my view, are not really that negative and their positives are super impressive. Todd Wenning highlighted a great quote from Neil Woodford - "In the short-term, share prices are buffeted by all sorts of influences, but over longer-time periods fundamentals shine through. Dividend growth is the key determinant of long-term share price movements, the rest is sentiment." Based on their cover, and their commitment to raises, looks like plenty of dividend growth ahead for Wal-mart. They are through to the Final Four where they await the winner of Baxter and CH Robinson

The Dividend Compass Cup rules are straightforward, we run the two quality, wide moat companies through the Dividend Compass to analyze which is the more interesting investing candidate. Todd Wenning's Dividend Compass scores them 1-5.
First up Exxon Mobil, basically no debt, increasing dividend growth and solid ROE.
Exxon Mobil Metrics
Exxon Mobil scores

Wal-mart metrics
Put it all together and you get a sizzling 4.57 five year averages. About the only area Wal-mart struggles is margins, and frankly - how concerned should we be about that? After all, its the Bentonville business model.
Wal-mart score:

Exxon Mobil has a great track record, but Wal-mart is simply playing at a different level here, even their negatives, in my view, are not really that negative and their positives are super impressive. Todd Wenning highlighted a great quote from Neil Woodford - "In the short-term, share prices are buffeted by all sorts of influences, but over longer-time periods fundamentals shine through. Dividend growth is the key determinant of long-term share price movements, the rest is sentiment." Based on their cover, and their commitment to raises, looks like plenty of dividend growth ahead for Wal-mart. They are through to the Final Four where they await the winner of Baxter and CH Robinson

Wednesday, October 23, 2013
Dividend Compass Match 9 - Coca Cola vs TIm Horton's
The Dividend Compass Cup moves to the Elite Eight (Equity Eight?) round. The first match in this round is Coca Cola versus Tim Horton's.
The Dividend Compass Cup rules are straightforward, we run the two quality, wide moat companies through the Dividend Compass to analyze which is the more interesting investing candidate. Todd Wenning's Dividend Compass scores them 1-5.
Let's get this started and revisit Coca Cola's metrics:
 The FCF cover is good but could be better. The margins and ROE are solid. Unlike some of the blue chips in the Dividend Compass, Coca Cola's sales growth remains in tact. Unfortunately, its dividend growth is only mild.
Coca Cola score:

This results in a steady, workhorse-like 4.19 five year average. Its easy to see why Buffett says to think about Coca Cola as owning a bond.
TIm Horton's has a stellar set of metrics, lower debt than Coca Cola. Much better dividend growth and coverage (albeit off a much lower base).
Tim Horton's metrics:

Those numbers are hotter than a cup of Tim Horton's coffee and they are good for a near perfect 4.95 five year average from the Dividend Compass.
Tim Horton's score:

Coca Cola has the higher yield, but Tim Horton's has the higher score from Dividend Compass (~20% better on five year average) and that's good enough to get Tim Horton's through to the Final Four where they will face the winner of Microsoft and Procter and Gamble.

The Dividend Compass Cup rules are straightforward, we run the two quality, wide moat companies through the Dividend Compass to analyze which is the more interesting investing candidate. Todd Wenning's Dividend Compass scores them 1-5.
Let's get this started and revisit Coca Cola's metrics:
Coca Cola score:

This results in a steady, workhorse-like 4.19 five year average. Its easy to see why Buffett says to think about Coca Cola as owning a bond.
TIm Horton's has a stellar set of metrics, lower debt than Coca Cola. Much better dividend growth and coverage (albeit off a much lower base).
Tim Horton's metrics:
Those numbers are hotter than a cup of Tim Horton's coffee and they are good for a near perfect 4.95 five year average from the Dividend Compass.
Tim Horton's score:

Coca Cola has the higher yield, but Tim Horton's has the higher score from Dividend Compass (~20% better on five year average) and that's good enough to get Tim Horton's through to the Final Four where they will face the winner of Microsoft and Procter and Gamble.

Wednesday, October 16, 2013
Dividend Compass Cup Match 8- Baxter vs Novo Nordisk
In the last match, Procter & Gamble beat out Unilever to advance in the Dividend Compass Cup.
This match in the healthcare division is between two heavyweights - Baxter and Novo Nordisk.
The Dividend Compass Cup rules are straightforward, we run the two quality, wide moat companies through the Dividend Compass to analyze which is the more interesting investing candidate. Todd Wenning's Dividend Compass scores them 1-5.
Baxter is a company that really understands R&D - share Repurchases and Dividends. From 656 million shares outstanding in 2006, Baxter has trimmed its share count down to 552 million today. Luckily from our perspective it has not done this at the expense of its dividend. Baxter has a steady track record of double digit dividend growth
Baxter metrics

Baxter's only cause for concern is its recent FCF cover, this is a high priority item for the Dividend Compass, but other than FCF cover and a good not great sales growth number its a sea of 5 point scores for Baxter. That will be tough to beat.
Baxter scores

Novo Nordisk has built a wide moat business through its diabetes treatments. Its operatin metrics show a company that is well run from all the key perspectives.
Novo Nordisk metrics
 That is as good a set of numbers are you will see, acres of coverage, high growth and Return on Equity. The recent scores are all 5s
Novo Nordisk scores

And so in the last match of Round 1, we have a tie based on 5 year average. Both Baxter and Novo Nordisk come in at 4.86. These are two deserving companies, but we will hand the match to Baxter, Baxter's 3% forward yield is good enough to get the edge over Novo Nordisk's 1.3% yield
That's a wrap on round one and we look forward to round 2.

This match in the healthcare division is between two heavyweights - Baxter and Novo Nordisk.
The Dividend Compass Cup rules are straightforward, we run the two quality, wide moat companies through the Dividend Compass to analyze which is the more interesting investing candidate. Todd Wenning's Dividend Compass scores them 1-5.
Baxter is a company that really understands R&D - share Repurchases and Dividends. From 656 million shares outstanding in 2006, Baxter has trimmed its share count down to 552 million today. Luckily from our perspective it has not done this at the expense of its dividend. Baxter has a steady track record of double digit dividend growth
Baxter metrics
Baxter's only cause for concern is its recent FCF cover, this is a high priority item for the Dividend Compass, but other than FCF cover and a good not great sales growth number its a sea of 5 point scores for Baxter. That will be tough to beat.
Baxter scores

Novo Nordisk has built a wide moat business through its diabetes treatments. Its operatin metrics show a company that is well run from all the key perspectives.
Novo Nordisk metrics
Novo Nordisk scores

And so in the last match of Round 1, we have a tie based on 5 year average. Both Baxter and Novo Nordisk come in at 4.86. These are two deserving companies, but we will hand the match to Baxter, Baxter's 3% forward yield is good enough to get the edge over Novo Nordisk's 1.3% yield
That's a wrap on round one and we look forward to round 2.

Dividend Compass Cup Match 7 - Procter & Gamble versus Unilever
In the last match of the Dividend Compass Cup, Walmart eked out a win over McCormick Spice. In this match we are sticking with the store shelves theme - Procter & Gamble (PG) versus Unilever (UL).
The Dividend Compass Cup rules are straightforward, we run the two quality, wide moat companies through the Dividend Compass to analyze which is the more interesting investing candidate. Todd Wenning's Dividend Compass scores them 1-5.
Procter & Gamble has continuously paid its dividend since 1890, its raised its dividend 57 years running.
Procter & Gamble may have gone through some churn at the executive level with the short reign of Bob McDonald, however a glance at the Dividend Compass shows that while slowing its not really in dire straits.
PG Metrics

Consistently good margins and interest coverage are enough to overcome low/no growth, and meh FCF cover.
PG Score:

The overall mark for five year average is a strong 4.17, however the last three years are less impressive.
Turning to Unilever, as with Royal Dutch Shell, Unilever is listed in the UK and in the Netherlands. We'll focus on the UK listing (UL) since the UK market has a dividend tax treaty with the US.
Unilever brings very strong REturn on Equity and its balance sheet generally looks better than P&G. However like P&G, Unilever struggles with earnings and FCF Cover. On top of that Unilever is all over the map on dividend growth, not as consistent as you might hope.
Unilever Metrics
 The combined effort for Unilever shows that despite strong slaes growth, its not trickling down to the parts that most matter for income investors
Unilever score

This match goes to Procter & Gamble, the firm has had a slowing couple of year, but even its 3.75 recent low score is good enough to beat Unilever's five year average.
P&G cannot celebrate for long since they now have to go up against the mighty Microsoft

The next match is the final round one match, we move to healthcare - Baxter versus Novo Nordisk.
The Dividend Compass Cup rules are straightforward, we run the two quality, wide moat companies through the Dividend Compass to analyze which is the more interesting investing candidate. Todd Wenning's Dividend Compass scores them 1-5.
Procter & Gamble may have gone through some churn at the executive level with the short reign of Bob McDonald, however a glance at the Dividend Compass shows that while slowing its not really in dire straits.
PG Metrics
Consistently good margins and interest coverage are enough to overcome low/no growth, and meh FCF cover.
PG Score:

The overall mark for five year average is a strong 4.17, however the last three years are less impressive.
Turning to Unilever, as with Royal Dutch Shell, Unilever is listed in the UK and in the Netherlands. We'll focus on the UK listing (UL) since the UK market has a dividend tax treaty with the US.
Unilever brings very strong REturn on Equity and its balance sheet generally looks better than P&G. However like P&G, Unilever struggles with earnings and FCF Cover. On top of that Unilever is all over the map on dividend growth, not as consistent as you might hope.
Unilever Metrics
Unilever score

This match goes to Procter & Gamble, the firm has had a slowing couple of year, but even its 3.75 recent low score is good enough to beat Unilever's five year average.
P&G cannot celebrate for long since they now have to go up against the mighty Microsoft

The next match is the final round one match, we move to healthcare - Baxter versus Novo Nordisk.
Monday, October 14, 2013
Dividend Compass Match 6- McCormick Spice vs Wal-mart
In Match 5 is TIm Horton's squeaked by McDonald's. In Match 6, we have to answer the question - is it better to invest in a company with products sold at Wal-mart or invest in Wal-mart directly? The answer will determine who goes on to the next round in the Dividend Compass Cup.
The Dividend Compass Cup rules are straightforward, we run the two quality, wide moat companies through the Dividend Compass to analyze which is the more interesting investing candidate. Todd Wenning's Dividend Compass scores them 1-5.
McCormick Spice is world's leading spice maker, selling in grocery stores, Wal-mart and to restaurant operators like YUM Brands. They have also paid a dividend since 1925. As you might expect, margins and Return on Equity for spice are reasonably good.
McCormick Spice metrics

McCormick Spice score:

Wal-mart's turn - they have really turned in an impressive dividend growth track record. Better yet, there is room to run for more dividend growth, Wal-mart easily covers its dividend on an Earnings and FCF basis.
Wal-mart metrics:

Wal-mart score

McCormick Spice versus Wal-mart is another close call, but this match goes to Wal-mart by a nose with its superior 5 year average, dividend growth and FCF cover. Wal-mart will move to the next round to match up with Exxon Mobil.

Saturday, October 12, 2013
Dividend Compass Match 5- McDonald's vs Tim Horton's
In Match 4, we had two smaller, lesser known companies meet up - CH Robinson (CHRW) defeated Ritchie Brothers Auctioneers (RBA).
Match 5 is all about international icons - McDonald's (MCD) versus Tim Horton's (THI) two franchises with moats that stretch from one ocean to another.
The Dividend Compass Cup rules are straightforward, we run the two quality, wide moat companies through the Dividend Compass to analyze which is the more interesting investing candidate. Todd Wenning's Dividend Compass scores them 1-5.
McDonald's main weakness is FCF cover it also shows some very mild slow down, likely from Europe. Other than that its a compelling set of metrics across the board
McDonald's Metrics:

McDonald's puts up a strong 5 year average score but some slow down is evident in 2012 and TTM scores. Note that most companies would be very happy with McDonald's "bad" scores. One problem for McDonald's is their weakest area - FCF Cover - is the one that's most important to income investors in general and the Dividend Compass specifically.
McDonald's score:

Next up, from the great white north, featuring breakfast, lunch, dinner, coffee and Timbits - Tim Horton's.
Hang on to your hats, these metrics are hotter than a large cup of coffee. Very low debt, high ROE, and lots of FCF/Earnings cover.
Tim Horton's metrics:

That is all good for a near perfect 4.95 five year average score from the Dividend Compass
Tim Horton's score:

Tim Horton may have been only an average pro hockey player, but Tim Horton's Dividend Compass score is in the upper echelon. What is not to like? Just this - Tim Horton's pays only a 1.8% dividend yield versus McDonald's stout 3.4% yield. The lower yield is offset partially by excellent (though relatively recent) dividend growth. Even if Tim Horton's paid a higher dividend, its coverage metrics would hold, so given that that is good enough to get TIm Horton's through to the second round to square off with Coca Cola.

Next up, Match 6 - McCormick Spice versus Wal-mart
Friday, October 11, 2013
Dividend Compass Match 4- CH Robinson vs Ritchie Brothers Auctioneers
In Match 3 of the Dividend Compass Cup, Microsoft narrowly defeated IBM.
In Match 4, we have two smaller companies going head to head - CH Robinson (CHRW) vs Ritchie Brothers Auctioneers (RBA). The Dividend Compass Cup rules are straightforward, we run the two quality, wide moat companies through the Dividend Compass to analyze which is the more interesting investing candidate. Todd Wenning's Dividend Compass scores them 1-5.
CH Robinson began paying its dividend in 1997 and Ritchie Brothers has paid since 2003. So we have two relative newcomers compared to some of the matchups in the competition so far. Let's see how they stack up.
CH Robinson metrics:

CH Robinson Score:

Meanwhile Ritchie Brothers Auctioneers has improved its FCF cover and is overall trending in the opposite direction.
Ritchie Brothers Auctioneers metrics:

Ritchie Brothers Auctioneers scores:

This match goes to CH Robinson, its win is not without question marks though. in basketball terms its like a team that built a big first half lead and then barely managed to hold on to the victory. Still a 4.2 five year average exceeds Ritchie Brothers best year 4.15 and that is good enough to make the next round.

Next up is a border battle, McDonald's versus Tim Horton's.
Thursday, October 10, 2013
Dividend Compass Match 3- IBM vs Microsoft
In Match 2 of the Dividend Compass Cup, we had Exxon Mobil beating out Royal Dutch Shell.
In Match 3, IBM squares off with Microsoft. The Dividend Compass Cup rules are straightforward, we run the two quality, wide moat companies through the Dividend Compass to analyze which is the more interesting investing candidate. Todd Wenning's Dividend Compass scores them 1-5.
This matchup focuses us on what was historically a very unlikely place to hunt for income investments - the tech sector. Tech companies do not have a reputation as dividend payers, but look at Cisco paying 3% and Intel paying 3.9% yields. There are lots of interesting income ideas in tech, including this match - IBM (IBM) and Microsoft (MSFT).
IBM paid its first dividend all the way back in 1913. IBM has paid a quarterly dividend each quarter since 1916 and increased its dividends for the last 18 years. Clearly the dividend matters to management.
Microsoft's own dividend journey began more recently, the company initiated its dividend in 2003 whilst sitting on around $40B in cash. Let's see how these two companies stack up to the Dividend Compass.
IBM has put up excellent numbers like clockwork. Its dividend yield is low which makes hitting the coverage mark easier. Another thing that makes coverage easier is eye popping (and buyback enhanced) Return on Equity north of 70%.
IBM metrics:

Sales growth aside, these metrics are as good or better than anything we have seen so far in the Dividend Compass Cup. And the scoring backs this up to the tune of a 4.85 five year average score.
IBM score:

I must say when I look at the numbers above its hard to imagine any company beating that, its close to perfection at least where Dividend Compass is concerned. Let's see how Redmond answers.
Microsoft Metrics:

Microsoft gets over every hurdle with room to spare. Its last three years do not contain any missteps. Two consecutive fives in 2013 and 2012.
Microsoft score:

Going off of the 5 year averages this one is really too close to call IBM comes in 4.85 and Microsoft at 4.83. So far the Dividend Compass has delivered clear winners on a 5 year time scale, here we are in rounding error territory and so a judgement call is in order. IBM has history on its side and a very slight 5 year advantage, however Microsoft (3.3% dividend) pays a far higher current yield than IBM (2.1%)...and that is good enough for victory in this case. Congratulations Steve Ballmer, you may be retiring but at least you will be able to savor a victory in the Dividend Compass Cup.

Next up Match 4, CH Robinson versus Ritchie Brothers Auctioneers.
Wednesday, October 9, 2013
Dividend Compass Match 2 - Exxon Mobil vs Royal Dutch Shell
In Match 1 of the Dividend Compass Cup, we had Coca Cola narrowly defeating Pepsi.
The Dividend Compass Cup rules are straightforward, we run the two quality, wide moat companies through the Dividend Compass to analyze which is the more interesting investing candidate. Todd Wenning's Dividend Compass scores them 1-5.
In Match 2, we have another class of the titans - Exxon Mobil (XOM) versus Royal Dutch Shell (RDS.B).
As the saying goes, the best investment is a well run oil company, the second best investment is a poorly run oil company.
Interesting to income investors? History of dividends? These two deliver. Exxon has paid a dividend continuously since 1882. It has increased its dividend for the last thirty years. Shell has paid dividends continuously since 1945. One note here for US investors is that Royal Dutch Shell has two listings, one in the Netherlands (RDS.A) and one in the UK (RDS.B), we look at the RDS.B listing since the ADRs are not subject to an extra foreign dividend tax for US investors.
First up is Exxon Mobil. The picture here shows strong pluses including - negligible debt, excellent return on Equity. And there are some areas of concern in declining FCF cover and tepid dividend growth.
Exxon Mobil's metrics:
Exxon has until recently preferred share buybacks over double digit dividend raises. Good to see the latter getting in recent months.
All of that is good for a solid 4.2 score from the Dividend Compass over a 5 year average, in fact 2012 was a near perfect 4.9.
Exxon Mobil's Dividend Compass score:

A 4.2 is a tough number to beat, let's see if Royal Dutch Shell is up to the challenge.
Unfortunately for Royal Dutch Shell, it struggles in two important areas - FCF cover and Dividend Growth. Royal Dutch Shell's metrics:
 The overall metrics are probably good enough for Royal Dutch Shell to beat out most other dividend payers, but up against Exxon Mobil you cannot miss on very much, and together FCF Cover and Dividend growth account for 35% of the total Dividend Compass score.
Royal Dutch Shell's Dividend Compass score:

Like Exxon Mobil, Royal Dutch Shell operates with very low leverage. However it struggles on FCF coverage and dividend growth rate categories. The result is 3.17 five year average, Royal Dutch Shell's best year is a 3.95 which is stil below Exxon Mobil's average year. This puts Exxon Mobil through to the next round to face the winner of McCormick and Wal-Mart.
Note that this is not to say that Royal Dutch Shell is a poorly run company. In fact, former Exxon Mobil CEO Lee Raymond listed Royal Dutch Shell as the competitor he most respected. For investors that prize current yield over all else, Royal Dutch Shell has for years been around 2 percentage points higher for current yield than Exxon. Still the Dividend Compass puts Exxon Mobil through to the Elite Eight.
Here is the bracket through two matches:
 Next up, Match 3 - tech showdown IBM versus Microsoft.
The Dividend Compass Cup rules are straightforward, we run the two quality, wide moat companies through the Dividend Compass to analyze which is the more interesting investing candidate. Todd Wenning's Dividend Compass scores them 1-5.
In Match 2, we have another class of the titans - Exxon Mobil (XOM) versus Royal Dutch Shell (RDS.B).
As the saying goes, the best investment is a well run oil company, the second best investment is a poorly run oil company.
Interesting to income investors? History of dividends? These two deliver. Exxon has paid a dividend continuously since 1882. It has increased its dividend for the last thirty years. Shell has paid dividends continuously since 1945. One note here for US investors is that Royal Dutch Shell has two listings, one in the Netherlands (RDS.A) and one in the UK (RDS.B), we look at the RDS.B listing since the ADRs are not subject to an extra foreign dividend tax for US investors.
First up is Exxon Mobil. The picture here shows strong pluses including - negligible debt, excellent return on Equity. And there are some areas of concern in declining FCF cover and tepid dividend growth.
Exxon Mobil's metrics:

Exxon has until recently preferred share buybacks over double digit dividend raises. Good to see the latter getting in recent months.
All of that is good for a solid 4.2 score from the Dividend Compass over a 5 year average, in fact 2012 was a near perfect 4.9.
Exxon Mobil's Dividend Compass score:

A 4.2 is a tough number to beat, let's see if Royal Dutch Shell is up to the challenge.
Unfortunately for Royal Dutch Shell, it struggles in two important areas - FCF cover and Dividend Growth. Royal Dutch Shell's metrics:

Royal Dutch Shell's Dividend Compass score:

Like Exxon Mobil, Royal Dutch Shell operates with very low leverage. However it struggles on FCF coverage and dividend growth rate categories. The result is 3.17 five year average, Royal Dutch Shell's best year is a 3.95 which is stil below Exxon Mobil's average year. This puts Exxon Mobil through to the next round to face the winner of McCormick and Wal-Mart.
Note that this is not to say that Royal Dutch Shell is a poorly run company. In fact, former Exxon Mobil CEO Lee Raymond listed Royal Dutch Shell as the competitor he most respected. For investors that prize current yield over all else, Royal Dutch Shell has for years been around 2 percentage points higher for current yield than Exxon. Still the Dividend Compass puts Exxon Mobil through to the Elite Eight.
Here is the bracket through two matches:

Subscribe to:
Posts (Atom)